Applications and Interpretation | Statistics and Probability
Give Me Five
Objectives

- Students will explore tree diagrams and expected values.
- Students will be asked to differentiate between independent and dependent events, as well as combining probabilities.
- Students will try to make a connection with how to understand these topics in IB Mathematics courses and on their final assessments
Vocabulary
- Outlier
- Quartile
- Inter-Quartile Range
- Five Number Summary
- Box and Whisker Diagram
About the lesson
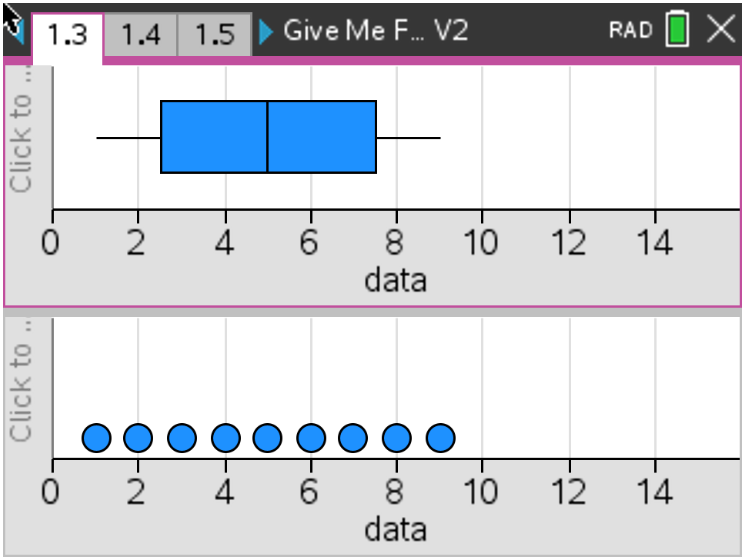
This activity explores the calculations of the five figure summary: {min, Q1, median, Q3 and max}. How is an outlier determined? What is positive / negative skew? By physically dragging the maximum point students can determine when the whisker ‘breaks’ and an outlier is created. The connection between the dot plot and the box and whisker plot improves the visual power of this dynamic interaction.
About the Lesson
This activity explores the calculations of the five figure summary: {min, Q1, median, Q3 and max}. How is an outlier determined? What is positive / negative skew? By physically dragging the maximum point students can determine when the whisker ‘breaks’ and an outlier is created. The connection between the dot plot and the box and whisker plot improves the visual power of this dynamic interaction.
